October 30, 2026
4 Square Chart Guide for Fashion Line Reviews
A 4 square chart sorts fashion styles into four decisions. See axes, scores, quadrant actions, and a line-review template.
A 4 square chart is a 2×2 matrix that crosses two axes, each split into two categories, to create four decision cells for sorting styles, colorways, and asset requests before line review. Sprello fits after the plot as the visual catalog layer for reviewing selected concepts, not as the chart itself.
Published 16 March 2026
If everyone agrees a style is promising, but nobody agrees what promising means, what has the line review decided?
A useful chart makes that disagreement visible. Before anyone places a style, the team must name the axes, define the midpoint, and create an insufficient-data status outside the grid.
What Is a 4 Square Chart?
A long concept list tells you what the team has proposed. A 4 square chart makes reviewers judge each proposal against explicit variables, so a designer can't call a style strong without saying whether that means commercial potential, production readiness, or something else.
Say a home brand is reviewing familiar bedding, a new tabletop family, and an expansion into another region. Those aren't just competing ideas. They involve different combinations of product and market uncertainty.
A familiar business example
As described in the Ansoff matrix guide, Igor Ansoff's Product–Market Expansion Grid appeared in Harvard Business Review in 1957 and crossed existing versus new products with existing versus new markets to produce four growth options.
| Product and market combination | Growth option | Assortment translation |
|---|---|---|
| Existing product, existing market | Market penetration | Support the current assortment with established buyers |
| Existing product, new market | Market development | Take known styles to a new account or region |
| New product, existing market | Product development | Add a product family for the current buyer |
| New product, new market | Diversification | Introduce an unfamiliar family to an unfamiliar market |
The existing-product, existing-market combination is the most familiar. Changing either the product or the market adds uncertainty; changing both asks the team to assess both uncertainties together.
The chart classifies the decision. It doesn't prove that the decision will succeed.
That distinction matters in line review. The chart helps merchandisers compare options and set priorities, but it doesn't forecast demand or calculate the right buy quantity.
Which Axes Fit a Fashion 4 Square Chart?
Choose the review question before choosing the axes. Then write a unit beside each axis so reviewers know what evidence belongs there.
Fashion 4 square chart axis pairs
| Use | X axis | Y axis | Unit to write on each axis |
|---|---|---|---|
| Assortment triage | Commercial potential | Production complexity | Expected margin percent; complexity from SKU count and lead time |
| Growth options | New vs existing product | New vs existing market | Binary: existing or new |
| Line-review risk | Expected margin or demand | Lead time or sample risk | Margin percent or units; weeks of lead time |
| Asset priority | Business impact | Deadline proximity | Revenue at stake; weeks to launch |
| Colorway and size depth | Customer value of the variant | SKU count added | Expected units per variant; new SKUs per style |
Choose a question the team can answer
Use assortment triage when you need to distinguish attractive concepts from concepts that consume disproportionate development effort. Use growth options when the discussion concerns where the business should expand, rather than which sample should move first.
For line-review risk, choose margin or demand as the commercial measure. Don't let one reviewer assess margin while another assesses expected sales volume under the same label.
The same discipline applies to sample risk. If you measure weeks of lead time, label the axis lead time. If you assess approval uncertainty instead, describe the evidence that makes risk low or high.
A jewelry team might care about stone availability more than the number of design details. A beauty team might care about minimum order quantity more than packaging appearance. Those differences belong in the scoring definition, not in an unrecorded discussion.
Define the midpoint before plotting
For a proposed workshop rubric, use a 1–5 scale: 4–5 counts as high, 1–2 as low, and 3 is a boundary band reviewed separately. These are scoring conventions, not industry benchmarks.
Keep raw measurements beside the score. A commercial-potential score without its margin assumption or demand estimate is difficult to challenge constructively.
Also label direction. Complexity should increase upward if that's how the team intends to read the chart; deadline proximity needs an equally explicit rule because fewer weeks means greater urgency.
Practical rule: If reviewers can't explain what would move an item across a boundary, the axis definition isn't ready.
Once the labels and boundaries are agreed, prepare the evidence behind each score.
How Do You Build a 4 Square Chart?
Run the exercise against a specific decision, not the entire seasonal strategy. A focused question keeps reviewers from mixing product selection, inventory allocation, and creative scheduling in the same conversation.
The Four Field Matrix planning guide describes assigning the most important characteristics to the axes before sorting ideas. That order matters: axes selected after plotting merely justify preferences the team already holds.
Prepare the decision and evidence
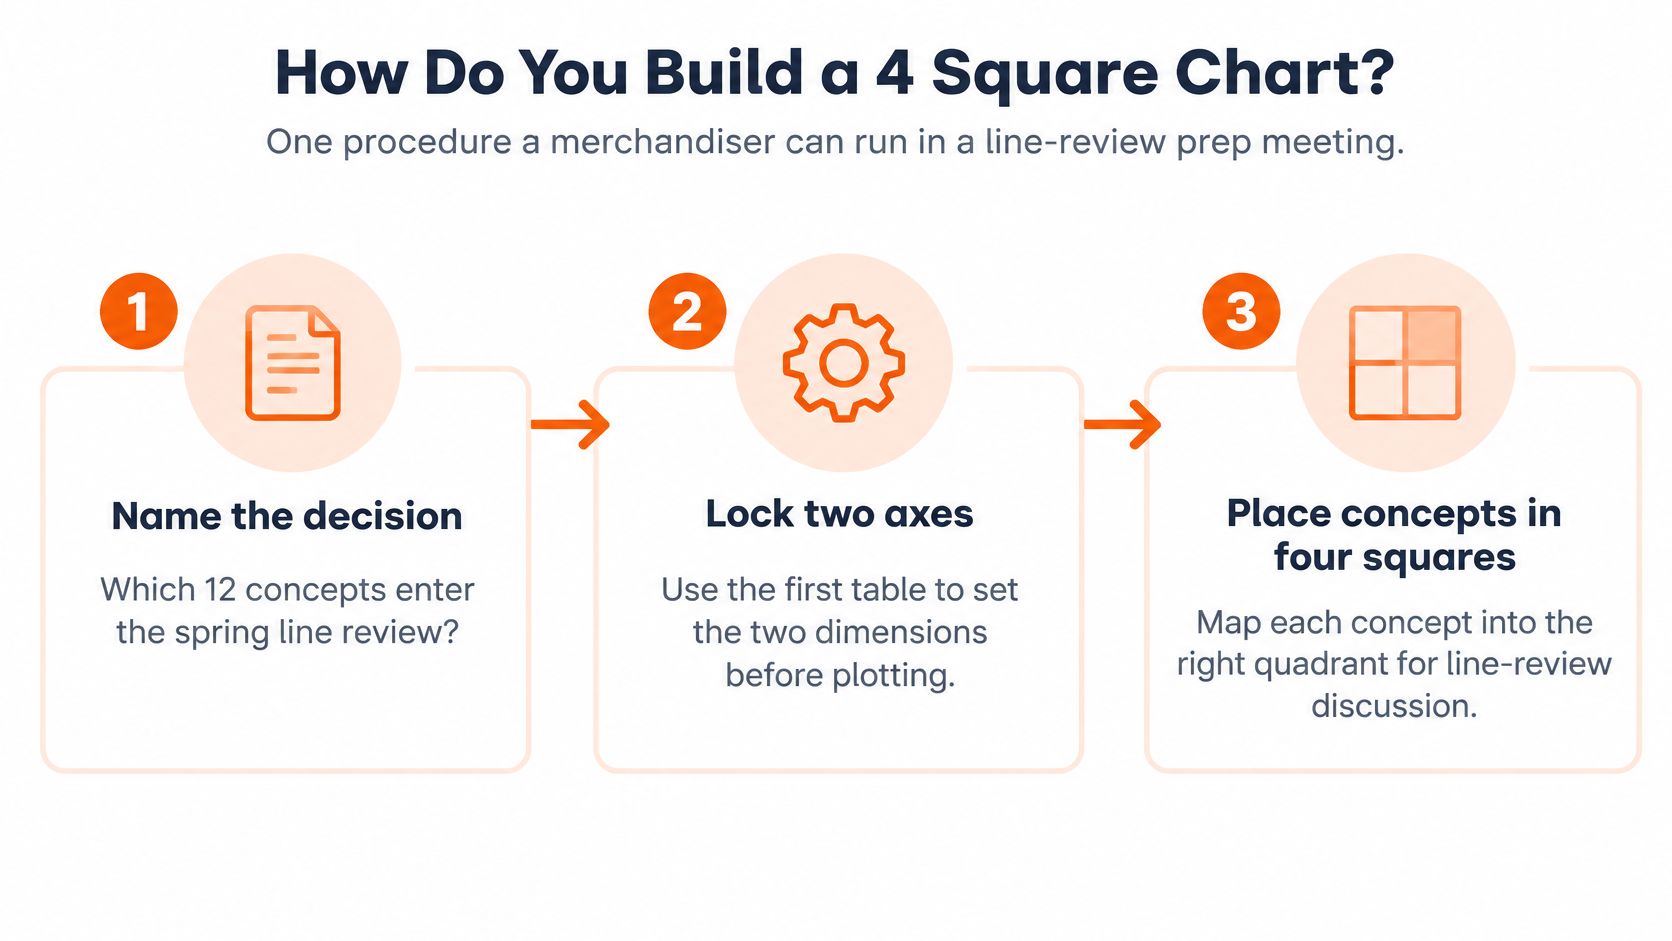
- Name the decision. For example, ask which 12 concepts should enter the spring line review. Treat this as a hypothetical workshop question, not a required assortment size.
- Lock the axes. Choose a pair from the axis table and document the measurements that define high and low.
- Score each axis separately. Apply the proposed scale to evidence such as expected demand, margin, SKU count, lead time, risk, or channel reach. Don't let enthusiasm for a design inflate its readiness score.
- Show any weighting. If several criteria feed an axis, multiply each criterion's weight by its score and sum the results. Keep the weights visible so reviewers can distinguish a disagreement about evidence from a disagreement about priorities.
- Plot only supported items. If a concept lacks the evidence needed for an axis, mark it insufficient data. A sketch can be worth developing without being ready for commercial classification.
- Hold borderline items outside the cells. Keep midpoint scores and items within one score point of a threshold on a separate review list. That list is a sensitivity check, not another quadrant.
- Record the decision context. Save the date, owner, source material, threshold definitions, and reassessment trigger with the chart.
This visual summarizes the workshop sequence; the evidence checks still apply before placement.
Test the rubric on actual concepts
The following hypothetical scores illustrate how to preserve uncertainty instead of hiding it.
Four concepts scored on two axes
| Concept | Commercial potential (X) | Production complexity (Y) | Result |
|---|---|---|---|
| Hero knit cardigan | 5 | 2 | Scale candidate |
| Beaded evening dress | 2 | 5 | Rationalization candidate |
| Wide-leg trouser, new fabric | 3 | 3 | Borderline, held out |
| Sheer cape sketch | Insufficient evidence | 4 | Insufficient data |
The cardigan and dress have clear default placements, although their proximity to a boundary should still be checked. The trouser stays out because both assessments sit in the boundary band.
The cape has a different problem. Product development can assess its construction difficulty, but there's no demand or margin evidence to support the commercial axis.
Don't turn missing evidence into a low score. Low potential means the available evidence points downward; insufficient data means the team can't make that judgment yet.
For a high-stakes buy, use the chart as triage. Validate the shortlisted options through financial analysis or a more detailed decision model before committing inventory.
What Action Belongs in Each Quadrant?
Expedite launch-critical, high-impact asset requests. Schedule high-impact work without a near deadline, standardize or delegate urgent low-impact work, and defer or remove work that has neither impact nor urgency.
The Eisenhower Matrix guide hosted by Columbia University distinguishes urgent work from important work. Its practical purpose is to separate immediate consequences from work that contributes to longer-term outcomes.
Attach ownership to the placement
For asset requests, the deadline owner confirms urgency and the merchandising lead confirms business impact. For product concepts, the merchandising lead checks the commercial score while design or product development checks complexity.
A proposed high-score threshold, such as 4–5, only helps when both reviewers use the same evidence rules. Agreement on a number without agreement on its meaning isn't a repeatable decision.
Quadrant actions for a merchandising 4 square chart
| Quadrant | Default action | Who checks | Proof metric | Reassess when |
|---|---|---|---|---|
| High impact and urgent | Expedite into this launch | Merchandising lead | Time to launch | Deadline or inventory changes |
| High impact and not urgent | Schedule into the seasonal plan | Merchandising and design | Sell-through after launch | Next line review |
| Low impact and urgent | Use a standard workflow or delegate | Creative operations | Revision count | Request volume spikes |
| Low impact and not urgent | Defer or remove | Merchandising lead | Cost per approved deliverable | Season change |
| Borderline or score 3 | Hold out of all four cells | Both axis owners | Confidence of the source data | Missing cost, margin, or demand arrives |
For an assortment chart, the actions change with the axes.
| Commercial potential | Production complexity | Default assortment action |
|---|---|---|
| High | Low | Scale |
| High | High | Schedule a pilot |
| Low | Low | Simplify or delegate |
| Low | High | Drop |
Define approval and escalation
A quadrant assignment isn't purchase approval. A scale candidate still needs an approved commercial case, while a pilot needs a named question to resolve before further commitment.
If the axis owners disagree, record the disputed assumption and assign someone to resolve it. Don't average their judgments merely to get the item into a box.
Choose a proof metric that tests the original reasoning. Sell-through can test commercial selection; revision count can test a complexity assumption; asset reuse can test whether standardization was worthwhile.
Rewrite the plot when demand, inventory, a deadline, or a regional requirement changes. Review it again at each seasonal line review, even when nobody has flagged a problem.
How Does Assortment Planning Use the Chart?
Which styles should make the line, and how much depth should each receive? Assortment planning connects those decisions to budget, shelf space, and the number of variants a team carries. A peer-reviewed study of retail assortment planning models product selection under budget and shelf-space constraints, including variant count as a decision.
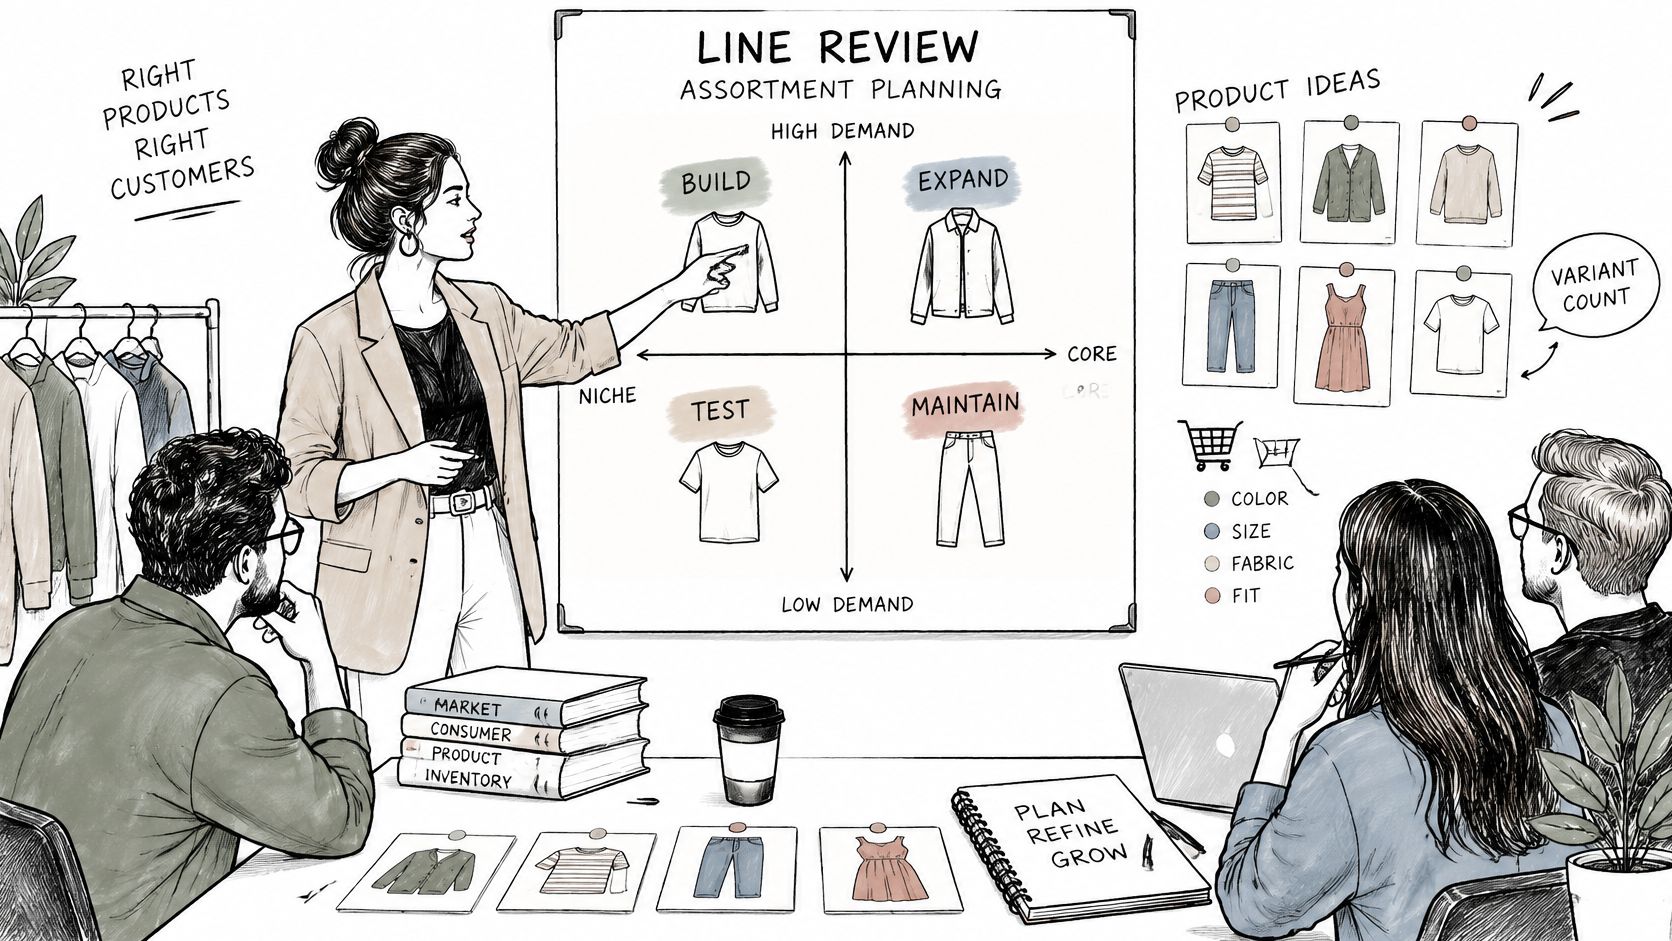
A 4 square chart gives the team a visual way to compare styles against its chosen axes. Keep each plotted item tied to the product record under review.
Evaluate breadth and depth together
Breadth describes the range of styles or categories. Depth describes the variants and inventory carried within them. Adding a colorway is therefore more than an aesthetic choice: it can add another SKU to manage.
One apparel example makes the multiplication clear: 3 styles × 2 colors × 2 sizes creates 12 combinations; adding a third size brings the total to 18, as shown in an apparel SKU study.
Consider how those choices might appear in a line review:
- Hero jacket: Strong commercial evidence and a known block support considering the style for scale.
- New silhouette: Attractive potential with an uncertain fit cycle suggests testing it as a pilot before making a larger commitment.
- Additional colorway: Weak buyer demand and added SKU administration make the variant a candidate for rationalization.
The same trade-off applies across categories. A beauty shade may have commercial appeal but require a minimum order quantity the team finds difficult to support. A jewelry style may depend on stone lead time, while a home finish may change the viable production run.
For more detail on breadth, depth, and line architecture, consult this guide to fashion assortment planning alongside the workshop sheet.
Review the concept before commissioning more samples
Sprello's visual workflow connects sketches, CADs, materials, and references to photoreal visuals and colorways in a shared product catalog. Buyers can review those concepts before the team decides which ones justify physical market samples.
The review context also includes a video:
Visual review helps compare concepts, but it cannot establish fit, construction feasibility, or inventory economics. Physical fit validation, tech packs, BOMs, pattern making, demand forecasting, and open-to-buy remain separate parts of product development and planning.
Where Should the Chart Live Next to PLM?
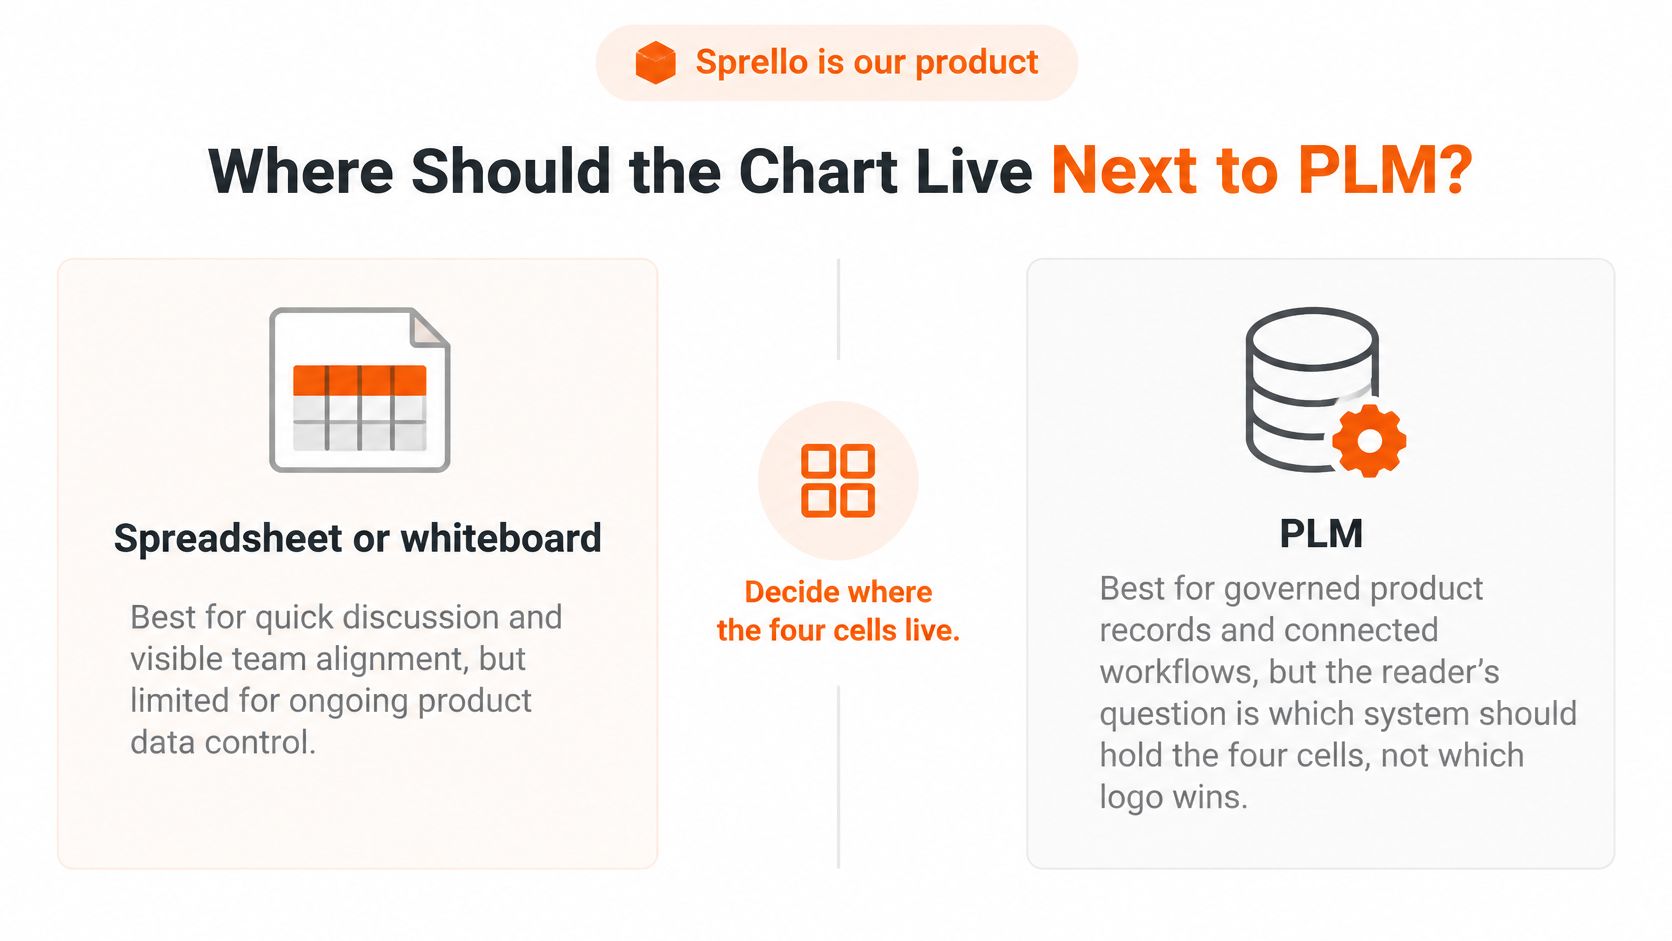
Where should a four-cell chart sit once the team has agreed on its axes and midpoint? Use a spreadsheet or whiteboard to discuss scores and placement, then keep the chart's reference ID beside the product record so reviewers can find the exact style and colorway.
The diagram separates workshop discussion from governed product information.
Where a 4 square chart sits among product tools
| Option | What it is for | What it does not do | Best moment |
|---|---|---|---|
| Spreadsheet or whiteboard | Agree on axes, scores, and cells in a meeting | Doesn't provide a purpose-built shared visual catalog or buyer-assortment workflow | First workshop |
| PLM | Product records and technical development controls | Isn't primarily a concept-visualization or creative-workflow tool; capabilities vary | After concept selection and throughout development |
| Planning suite | Forecast, budget, shelf, and open-to-buy calculations | Isn't primarily a concept-visualization or creative-workflow tool | When evaluating inventory commitments |
| Sprello | Assortment visualization, catalog-scale AI product photography, and brand-consistent creative workflows | Doesn't create tech packs, BOMs, or patterns, or perform demand forecasting or open-to-buy | For visualizing assortments and producing campaign content |
Keep the visual and technical handoffs distinct
A fashion design and development study reports complete development cycles ranging from 1 month to 14 months and salesman-sample production from 1 month to 6 months in the cases examined. Earlier concept review can support decisions before those physical stages, while technical approval remains a separate step.
Sprello is an AI workflow canvas for fashion, beauty, and lifestyle brands. Teams can use it to design production-ready creative workflows across SKUs, channels, regions, and seasons, with brand guardrails and shared visual workflows. It supports assortment visualization and catalog-scale content production; it does not replace technical product records or planning calculations.
For more context on the category, see this guide to fashion merchandising software. The chart helps the team discuss and record a decision; product and planning tools support the work that follows.
What to Do After the Four Cells Are Set?
Leave the meeting with a decision list, not just a photographed whiteboard. Each selected item needs a next action, an owner, and the evidence required for approval.
Scale candidates move into line review. Pilot candidates receive a focused visual review before more physical samples are commissioned; simplify candidates lose unnecessary colorways, sizes, or process steps; dropped items leave the active brief.
Close the meeting with an actionable handoff
For pilots, record the unresolved question beside the concept. Is the team testing buyer interest in the silhouette, the usefulness of a finish, or the strength of a color story?
Sprello can carry those concepts and colorways into a shared catalog with separate assortments by account or channel. Keep the season lineup aligned with the approved decision list, rather than preserving every concept just because someone created a visual.
Before the meeting ends, check:
- Axis units: Each label identifies what reviewers measured.
- High threshold: The agreed scoring boundary is written beside the grid.
- Exceptions: Borderline and insufficient-data items remain outside the cells.
- Accountability: Every action has an owner and a proof metric.
A tidy grid isn't the objective. A team that knows what to develop, test, simplify, and stop is.
Which Follow-Up Questions Come Up in Line Review?
How do I plot when data is incomplete or only qualitative?
Score what you can support using the agreed rubric, and record the qualitative evidence behind the judgment. Keep insufficient data as a separate status rather than placing a style just to finish the slide.
How is this different from SWOT or a BCG matrix?
SWOT organizes strengths, weaknesses, opportunities, and threats into lists rather than positioning each item against scored axes. BCG is a specific growth-share matrix; a generic 4 square chart uses the variables your team declares.
Does the chart set the buy quantity?
No. It triages styles and identifies decisions that need more work. Forecasting, inventory allocation, and open-to-buy remain planning responsibilities.
Can beauty, jewelry, and home use the same grid?
Yes, but the measurement rules need to match the category. Beauty teams may assess shade count and minimum order quantity, jewelry teams may assess metal or stone lead time, and home teams may assess finish options or size runs.
When is the chart wrong enough to redraw?
Redraw it when sell-through, inventory, a regional brief, or a missed sample date changes an item's position relative to the written threshold. Correct the underlying evidence first, then reconsider the action rather than moving the marker without explanation.
Sprello connects AI product visuals to a shared catalog, line review, wholesale line sheets, and buyer assortments for the concepts your chart marks as scale or pilot. Visit Sprello and book a demo to see how Canvas turns sketches, CADs, materials, and references into photoreal visuals and colorways.
Related
More to explore
Fresh reads
What Is a Context Diagram? Notation, Examples and Uses
Learn what is a context diagram: its system boundary, external entities and labeled flows, notation rules, and a fashion product-development example.

Bulletin Boards Online Compared for Brand Teams in 2026
Compare bulletin boards online for creative ops, remote review, and merchandising planning, with features, plan limits, and best uses for brand teams.
Requirement Document Template: 10 Picks for Fashion Teams
Compare 10 requirement document template options for PRDs and BRDs, with fit notes for fashion, beauty, jewelry, and home brand merchandising and design teams.