

So, what exactly is video marketing analytics? Think of it less as a technical chore and more as the process of listening to what your audience is telling you through their actions. It’s how you move beyond just counting views to truly understand who is watching your videos, how long they stick around, and what they do next. This insight is your key to creating content that genuinely connects and, ultimately, converts.
Why Video Analytics Are Your Secret Weapon

Making videos without looking at the analytics is a bit like driving a race car with your eyes closed. Sure, you're moving fast, but are you headed for the finish line or straight into a wall? The real magic of video marketing isn't just in the creation; it’s in understanding what happens after someone hits the play button.
That's where video marketing analytics comes in. It's the GPS for your content strategy. It gives you clear, turn-by-turn directions, guiding you away from expensive mistakes and directly toward your goals. This data is what separates a viral hit that actually grows your business from a costly campaign that just disappears into the void.
From Guesswork to Growth
Without data, you're just guessing. You might think a certain video style is a winner or that your audience loves long-form content, but analytics replaces those assumptions with cold, hard facts. It gives you a direct line into your viewers' behavior, showing you exactly what’s working and what’s not.
Analytics gives you an undeniable edge, allowing you to cut through the noise and connect with your audience on a level your competitors can’t match. It’s the tool that transforms your video efforts from an art project into a measurable business driver.
The return on investment speaks for itself; a huge 93% of marketers say they get a positive ROI from video. To see how this piece fits into the bigger picture, it's helpful to understand its role in digital marketing as a whole. This Beginner's Guide to Digital Marketing offers a great overview.
The Measurable Impact of Video
The numbers don't lie. When you have a video strategy that's informed by data, the impact is felt across the entire customer journey. It's not just about getting likes and shares.
- Brand Awareness: A massive 96% of marketers say video has helped them increase brand awareness.
- Website Traffic: 82% report seeing a direct jump in traffic to their website from their video content.
- Lead Generation: An impressive 88% connect their video efforts directly to generating new leads.
- Direct Sales: Nearly 84% can point to video as a driver of actual sales.
These stats paint a clear picture: when you measure and fine-tune your videos based on real data, you get real business results.
Decoding Your Video's Performance Report Card

So, you’ve published a video. Now what? You’re probably staring at an analytics dashboard that looks more like a complex spreadsheet than a simple thumbs-up or thumbs-down. Think of this dashboard as your video's report card. It doesn’t grade you on effort, but on cold, hard results, showing you exactly what’s working and what’s falling flat.
The language of this report card isn't English; it's data. Our job is to help you become fluent.
It's easy to get fixated on the wrong things, especially vanity metrics like "views." A high view count feels great, but what does it really mean if someone clicked off after three seconds? Did your message land? Probably not. We need to dig deeper to understand the real story the numbers are telling us.
To do that, it helps to understand the core concepts of measuring advertising effectiveness. This gives you the foundation to connect what's happening in your video to what's happening for your business.
Beyond the View Count
Let’s be clear: a view is just the start of the story. It tells you someone showed up to the party, but not if they had a good time or stayed for the main event. To get a real feel for your video's impact, you have to look at metrics that track genuine interest.
This is where the real work of video analytics begins. We’re moving past simple headcounts and into understanding viewer behavior. Two of the most important metrics on your report card are Watch Time and Audience Retention.
Watch Time is the total, cumulative time people have spent watching your video. It’s a huge deal because platforms like YouTube see long watch times as a strong signal of quality content. Videos with higher watch times often get a boost in search results and recommendations.
Here's an analogy: a view is like a customer walking into your shop. Watch time is how long they stick around to browse. A customer who walks in and immediately leaves isn't nearly as valuable as one who spends 20 minutes exploring every aisle.
Understanding Audience Retention
Audience Retention might just be the most powerful metric you have. It gives you a second-by-second breakdown of what percentage of your audience is still watching your video. This is usually shown as a graph, and learning to read it is like gaining a superpower.
This graph shows you the exact moments where you captured your audience's attention and, more importantly, where you lost them.
- Are people bailing in the first 10 seconds? Your intro might be too slow or irrelevant.
- Is there a big, sudden dip in the middle? Maybe that section was confusing, boring, or just dragged on too long.
This kind of detail lets you diagnose problems with surgical precision. You're no longer guessing what went wrong; the data points you to the exact spot that needs fixing for your next video. Keeping track of these versions and optimizations is where a solid video asset management system becomes invaluable.
Focusing on engagement is more critical than ever. With video content projected to make up around 82% of all internet traffic, the competition for eyeballs is fierce. Only the most engaging and well-crafted videos will succeed in capturing—and holding—attention.
The Essential Metrics That Drive Real Results
You can drown in data with video marketing, but not all of it matters. It’s easy to get lost in a sea of numbers, but only a handful truly tell you if your strategy is actually working. These are the metrics that go beyond vanity numbers and tie your videos directly to business results.
The best way to make sense of it all is to group your key performance indicators (KPIs) into three core categories: Engagement, Audience, and Conversion. When you understand these, you'll have a clear framework to see what’s broken, spot what’s working, and make your videos better every time.
Gauging Viewer Engagement
Engagement metrics cut to the chase and answer one simple question: Is anyone actually paying attention? They measure how people interact with your video, telling you if your content is genuinely interesting or just playing in the background.
- Play Rate: This is the percentage of people who hit the play button after seeing your video on a webpage or in their feed. A low play rate is a red flag. It might mean your thumbnail is boring, the video is in a bad spot, or your title just isn't grabbing anyone.
- Average View Duration: This metric shows, on average, how much of your video people watched. It's a fantastic gauge of how compelling your content is. A longer duration means you're holding their attention. Simple as that.
- Audience Retention Rate: This is your secret weapon. It’s a graph that shows you, second by second, what percentage of your audience is still watching. It’s a powerful diagnostic tool that lets you pinpoint the exact moments where viewers get bored and click away, helping you fix those slow intros or confusing segments in the future.
To get the full picture, especially on social media, you need to understand how to measure social media engagement that actually matters by looking past simple likes to what really signals genuine interest.
It turns out that product videos are incredibly effective, with 66% of marketers citing them as top performers. Right behind them is short-form, live-action content, which is a powerhouse for driving ROI, leads, and engagement.
Understanding Your Audience
Okay, so people are watching. But who are they? Audience metrics help you paint a detailed picture of your viewers, so you can be sure you're talking to the right crowd.
These insights are gold for fine-tuning your content and your targeting. For instance, if your video about retirement planning is a hit with 18-24 year olds, you've got a serious mismatch on your hands. Key metrics to watch here are demographics like age, gender, and geographic location.
This infographic lays out the different kinds of tools you can use to dig up this data, from the basics included on platforms to more advanced software.
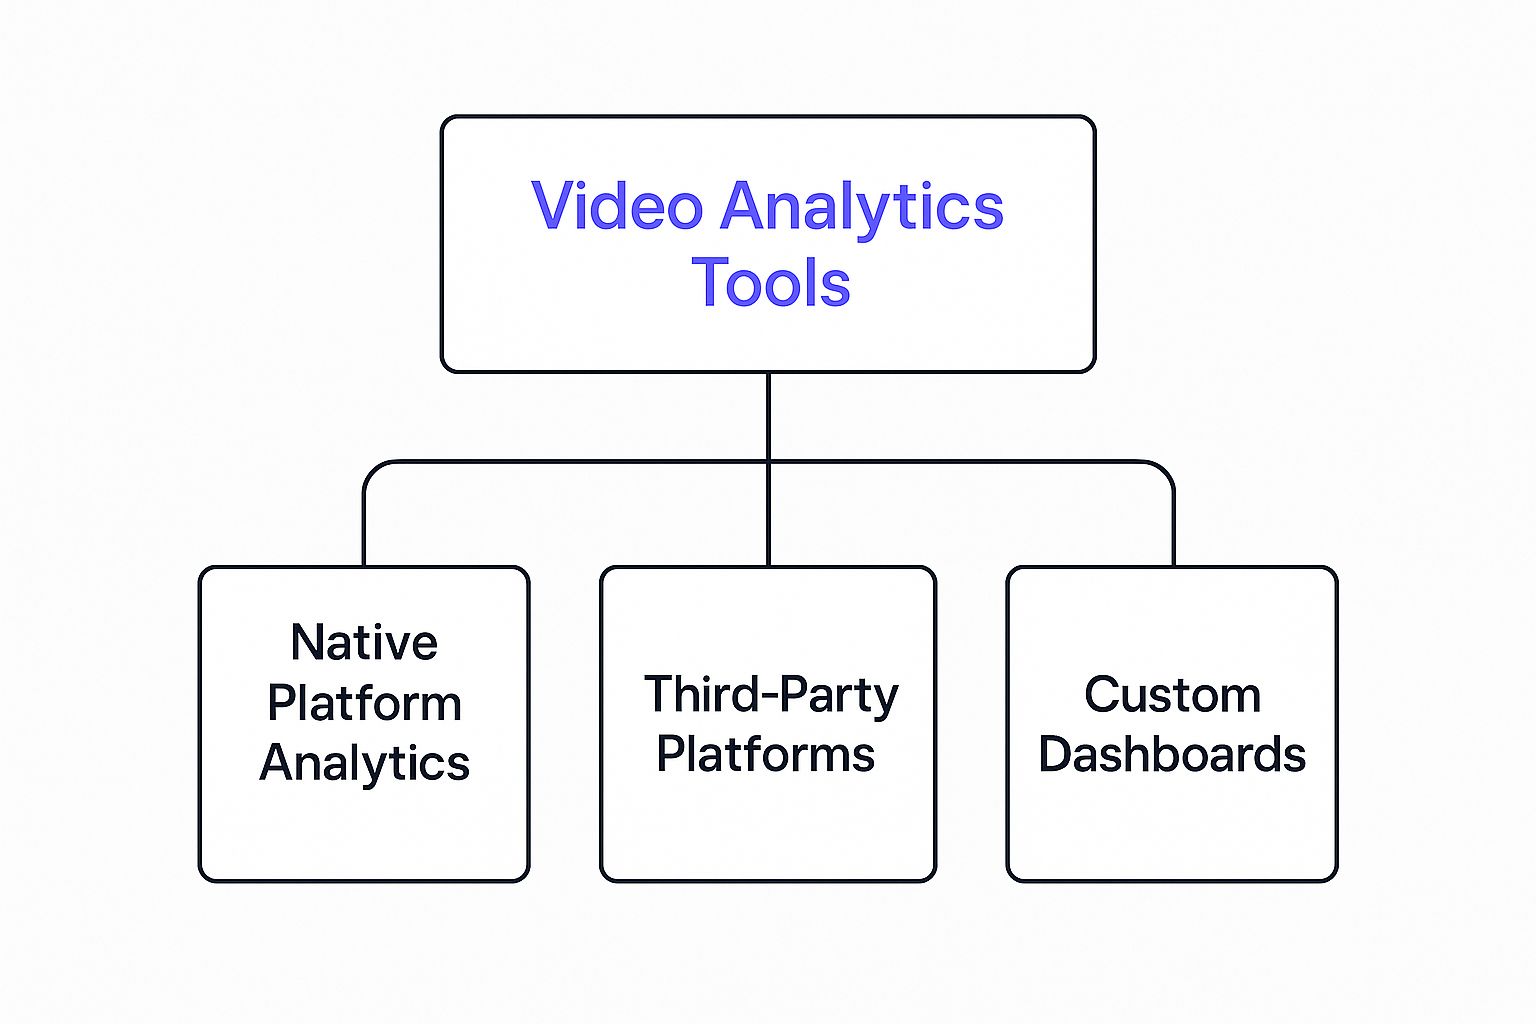
As you can see, you can start with free, built-in tools and then graduate to more specialized platforms as your video strategy gets more sophisticated.
Measuring Conversion and Business Impact
At the end of the day, your videos are there to make something happen. Conversion metrics are the all-important bridge between your content and your business goals. They're the final piece of the puzzle, telling you whether your videos are actually helping your bottom line.
A video can get amazing engagement and reach the perfect audience, but if it doesn't get them to take the next step, it hasn't truly done its job. Tracking these numbers is how you prove your video marketing is worth the investment.
Here are the conversion metrics you absolutely have to track:
- Click-Through Rate (CTR): This measures the percentage of viewers who clicked on a call-to-action (CTA) you placed in or near your video. A low CTR usually means your CTA is weak, confusing, or just easy to miss.
- Conversion Rate: This tracks how many viewers actually completed the goal—like signing up for your newsletter, downloading an ebook, or making a purchase. This is often the ultimate test of a video's success.
- Leads Generated: For B2B companies or anyone selling a service, counting the number of direct leads that came from a video is a powerful way to measure its value.
- Sales: By using special tracking links or dedicated landing pages, you can directly attribute sales to your video campaigns. This gives you a crystal-clear calculation of your return on investment.
By focusing on these essential metrics across engagement, your audience, and conversions, you can stop staring at confusing reports and start using your data as a clear roadmap for success.
Choosing the Right Video Analytics Tools
Picking the right tools for your video analytics can feel like trying to find one specific key on a janitor's giant, jangling keyring. There are so many options out there. The real goal isn't to find a single "best" tool, but to assemble a small toolkit that perfectly fits what your business is trying to achieve.
The good news? You probably already have powerful analytics at your fingertips, and they won't cost you an extra dime. These are called native analytics tools—the dashboards built right into the platforms where you're already posting videos. They are the absolute best place to start.
Start with Native Platform Analytics
Think of native tools as your first line of intelligence. They're convenient, free, and packed with data that's specific to each platform's unique audience and algorithm.
- YouTube Studio: For anyone serious about YouTube, this is the gold standard. It gives you a deep dive into crucial metrics like Audience Retention, Traffic Sources, and detailed viewer demographics.
- Meta Business Suite: If you're running video ads or posting on Facebook and Instagram, this is non-negotiable. It tracks things like 3-second views and cost per result, which is essential for making sure your ad budget is actually working.
- TikTok Analytics: Perfect for brands chasing younger demographics. TikTok’s analytics show you which sounds are trending, how your follower count is growing, and where your profile views are coming from, helping you ride the wave of a viral trend.
- LinkedIn Analytics: A must for B2B marketers. LinkedIn gives you specific data on your viewers' job titles, industries, and company sizes, so you can quickly see if you're reaching the right decision-makers.
Take this screenshot from YouTube Studio, for example. It gives you a quick, at-a-glance overview of your channel's vital signs.
You can instantly see how many views, watch hours, and subscribers you've gained. It’s a simple health check for your content strategy.
Everyone knows getting started with video is important. While a massive 95% of companies see video marketing as a key strategy, 37% of those who haven't jumped in say it's because they're not sure where to begin. Native tools completely remove that barrier, offering a straightforward way to start understanding your video performance. You can find more valuable insights on video marketing trends on Wix.com.
When to Upgrade to Third-Party Platforms
Native tools are fantastic, but they have their limits. The biggest one? They only show you data from their own little world. When you need a complete picture of how people are interacting with your videos across your entire marketing funnel, it's time to look at specialized third-party tools like Wistia, Vidyard, or Sprout Social.
These platforms are built for marketers who need to dig deeper. They offer a whole suite of features that native tools just don't have, helping you connect the dots between video views and your company's bottom line.
Here’s a good way to think about it: Native analytics are like the dashboard in your car—they tell you your speed and if you need gas. Third-party tools are like the diagnostic computer a mechanic plugs in to see exactly how every single part of the engine is performing.
Advanced Features of Specialized Tools
So, what extra firepower do you get when you invest in a third-party platform? You get features designed from the ground up to drive marketing results and prove ROI.
Key benefits of third-party tools include:
- Lead Generation Forms: You can pop an email capture form right inside your video. A potential customer can sign up for your newsletter without ever leaving the player.
- Viewer Heatmaps: These tools give you a visual map laid over your video, showing exactly which parts people re-watched, which parts they skipped, and where they dropped off. It’s like getting a report from a second-by-second focus group.
- CRM Integration: Many of these platforms talk directly to your Customer Relationship Management (CRM) software, like HubSpot or Salesforce. This means you can see that a specific lead watched a specific video for a specific amount of time—powerful stuff for your sales team.
- A/B Testing: You can easily test different thumbnails, titles, or even entirely different edits of a video to see what works best. It’s all about constant, data-driven improvement.
Ultimately, choosing the right tool comes down to your goals. If you're focused on broad brand awareness on social media, native analytics will probably give you everything you need. But if you’re running targeted B2B campaigns or need to prove the financial return on your video content, a specialized third-party platform is an investment you can't afford to skip.
Turning Your Data into Smarter Decisions
Let's be honest, raw data is just a pile of numbers. The real magic happens when you turn that noise into insight. Having charts and graphs is a great start, but the goal is to become a data storyteller—someone who can look at the numbers and see a clear path forward. This is how you shift from simply checking stats to building a data-driven strategy.
Think of it this way. Imagine you pull up your audience retention graph and see a huge nosedive within the first 10 seconds. That’s not just a bad metric; it's a bright, flashing sign telling you exactly where the problem is. Your hook isn't landing.
That single data point gives you a mission. Instead of guessing what went wrong, you have a specific, tangible problem to solve.
From Diagnosis to Actionable Tests
Once you’ve pinpointed a problem like a weak intro, you can start forming educated guesses—hypotheses—and testing them. This creates a powerful feedback loop. Suddenly, every video you publish becomes a small experiment, an opportunity to learn and get better.
For that 10-second drop-off problem, here are three simple tests you could run right away:
- Rework the Opening: Is your video kicking off with a slow logo animation or a rambling introduction? Try cutting straight to the chase. Start with a provocative question, a surprising fact, or the most visually interesting part of your video.
- Align Thumbnail and Title: The drop-off might be happening because your video doesn't deliver on its promise. Viewers click expecting one thing and bail when they get something else. Test a new thumbnail or title that more accurately reflects the video's core value.
- Front-Load the Payoff: Tell viewers exactly what they're going to get. Open with something like, "In the next 60 seconds, you'll learn three ways to..." This sets clear expectations and gives them a compelling reason to stick around.
This process turns your analytics from a boring report card into a creative playbook.
The goal is to create a cycle of continuous improvement. You analyze the data, identify a weakness, test a solution, and measure the results. This approach systematically improves the performance of every video you create.
A/B Testing Your Way to Success
This experimental mindset isn't just for your intros. A/B testing, or split testing, should be your best friend. It’s all about creating two versions of something to see which one gets better results. While some platforms have this built-in, you can easily run your own tests by changing just one thing at a time across different videos.
Here are a few key elements you should constantly be testing:
- Thumbnails: Try out different colors, using human faces versus graphics, or adding bold text overlays. A killer thumbnail can send your play rate through the roof.
- Calls-to-Action (CTAs): Experiment with your wording ("Learn More" vs. "Get Your Free Guide"), placement (mid-video vs. end screen), and even the button design.
- Video Length: Do short, snappy videos hold your audience's attention better? Or do they prefer deep dives? Test different lengths for similar topics and let the data decide.
- Distribution Channels: A video that crushes it on YouTube might need a totally different edit to work on TikTok. Understanding the nuances of different video distribution platforms is crucial for matching your content to the audience.
Digging into this data helps you understand not just what works, but why it works for your specific audience. It's no surprise that 28% of marketers are already using engagement graphs and heat maps to analyze performance. By adopting a testing mindset, you’re making decisions based on evidence, not just a gut feeling—and that’s how you get much better results.
Tailoring Your Video Strategy for Each Platform
One of the biggest mistakes I see people make in video marketing is blasting the same video across every social media channel. It just doesn't work. A video that kills it on LinkedIn will almost certainly die a quiet death on TikTok.
Every platform has its own unique vibe—its own audience, its own rules, and its own algorithm. To get real results, you have to play by their rules.
Think of it like this: You wouldn't wear a tuxedo to a backyard barbecue. In the same way, you need to dress your video content appropriately for the platform you're on. What spells success on one app is a total flop on another. This is where mastering video marketing analytics really begins: using platform-specific data to fine-tune your approach.
Mastering Different Video Environments
Let's break down how to think about three very different platforms. Each one needs a unique strategy, a different style of content, and a different way of looking at the numbers. This is how you go from just posting videos to strategically placing them for the biggest impact.
YouTube: The Video Search Engine: People go to YouTube to solve a problem, learn a skill, or dive deep into a topic. Think of it as a massive video library. Success here is all about Watch Time and Audience Retention. Your job is to create genuinely helpful or highly entertaining videos that people will search for and stick with.
Instagram Reels: The Attention Grabber: Instagram is a firehose of visual content. Your video has a split second to stop someone's thumb from scrolling. Success means creating punchy, eye-catching videos under 60 seconds. The metrics that matter most are Play Rate and Shares. Use trending audio, quick cuts, and a strong visual hook right at the start.
LinkedIn: The Professional Network: LinkedIn is the office, not the playground. People are there for career growth, industry news, and professional networking. Videos here should offer real value, share expert insights, or give a peek into your company culture. You’ll want to watch your Click-Through Rates and check audience demographics to see if you're reaching people with the right job titles.
The goal isn’t just to repurpose content; it's to intelligently re-format it. That 10-minute deep-dive on YouTube? It can be chopped into a dozen 30-second tips for Instagram Reels or transformed into a 2-minute thought leadership piece for LinkedIn.
Using Platform Data to Win
The analytics inside each platform are your roadmap.
If your Instagram Reels have a low share rate, it’s a clear signal that the content isn't compelling enough for people to send to their friends. If your LinkedIn video isn't getting clicks, your call-to-action is probably too weak or buried.
For short-form video in particular, you have to be able to create content quickly to keep up. If you're looking for tools to help with that, check out our guide on the 12 best AI video makers for TikTok. Many of those tools are great for creating native-style content for other platforms, too.
By digging into the data on each channel, you can stop throwing spaghetti at the wall. You can start creating videos that feel like they truly belong, making sure your message hits home every single time. This is what separates the pros from the amateurs.
Even after you get the hang of the basics, some common questions always seem to come up when you start digging into your video analytics. Let's tackle a few of the most frequent ones so you can feel completely confident in your strategy.
What Is the Most Important Metric?
If I had to pick just one, it would be Audience Retention. Why? Because it answers the most critical question: "Is my video actually interesting?" A view is nice, but it's a vanity metric if the viewer clicks away after only three seconds.
High retention is proof that your content is compelling enough to hold someone's attention. Think of it as a roadmap for your content—it literally shows you the exact moments where you lost your audience. This feedback is gold. It lets you pinpoint and fix problems, like a boring intro or a confusing middle section, making your next video that much better.
A view tells you someone showed up. Audience retention tells you if they stayed for the party. Focus on retention, and you’ll create content people genuinely want to watch from start to finish.
How Often Should I Check My Analytics?
When you first launch a video, I'd recommend checking in daily for the first week. This initial period is crucial for spotting any early momentum or catching major issues right out of the gate.
After that first week, you can ease up. A weekly check-in is usually plenty to keep an eye on performance and pull the numbers you need for your reports. The real trick is to avoid becoming obsessed. Hitting refresh on your dashboard every hour will just make you anxious over normal, tiny fluctuations. Your goal is to spot the meaningful, long-term trends, not get lost in the day-to-day noise.
Can I Actually Measure Video ROI?
You absolutely can, but it takes a little planning. The key is to connect your video’s performance to actual business results, bridging the gap between someone watching your video and making a purchase.
Here are a few practical ways to do this:
- Use tracking links (UTMs) in your video descriptions and calls-to-action.
- Embed clickable forms or buttons directly into your videos using tools like Wistia or Vimeo.
- Send viewers to a unique landing page created just for that video campaign.
By tracking where your leads and sales come from, you can tie them directly back to your video efforts and calculate a real, defensible return on your investment.
Ready to turn your existing assets into high-performing video ads in minutes? With Sprello, you can use AI to create engaging UGC-style videos without hiring actors or learning complex editing. Scale your content, test creative ideas faster, and drive real results. Start your free trial at https://sprello.ai.


